Highlights
- GIVEMESPORT took a look at some of the most dominant home field advantages in the NFL through the decades.
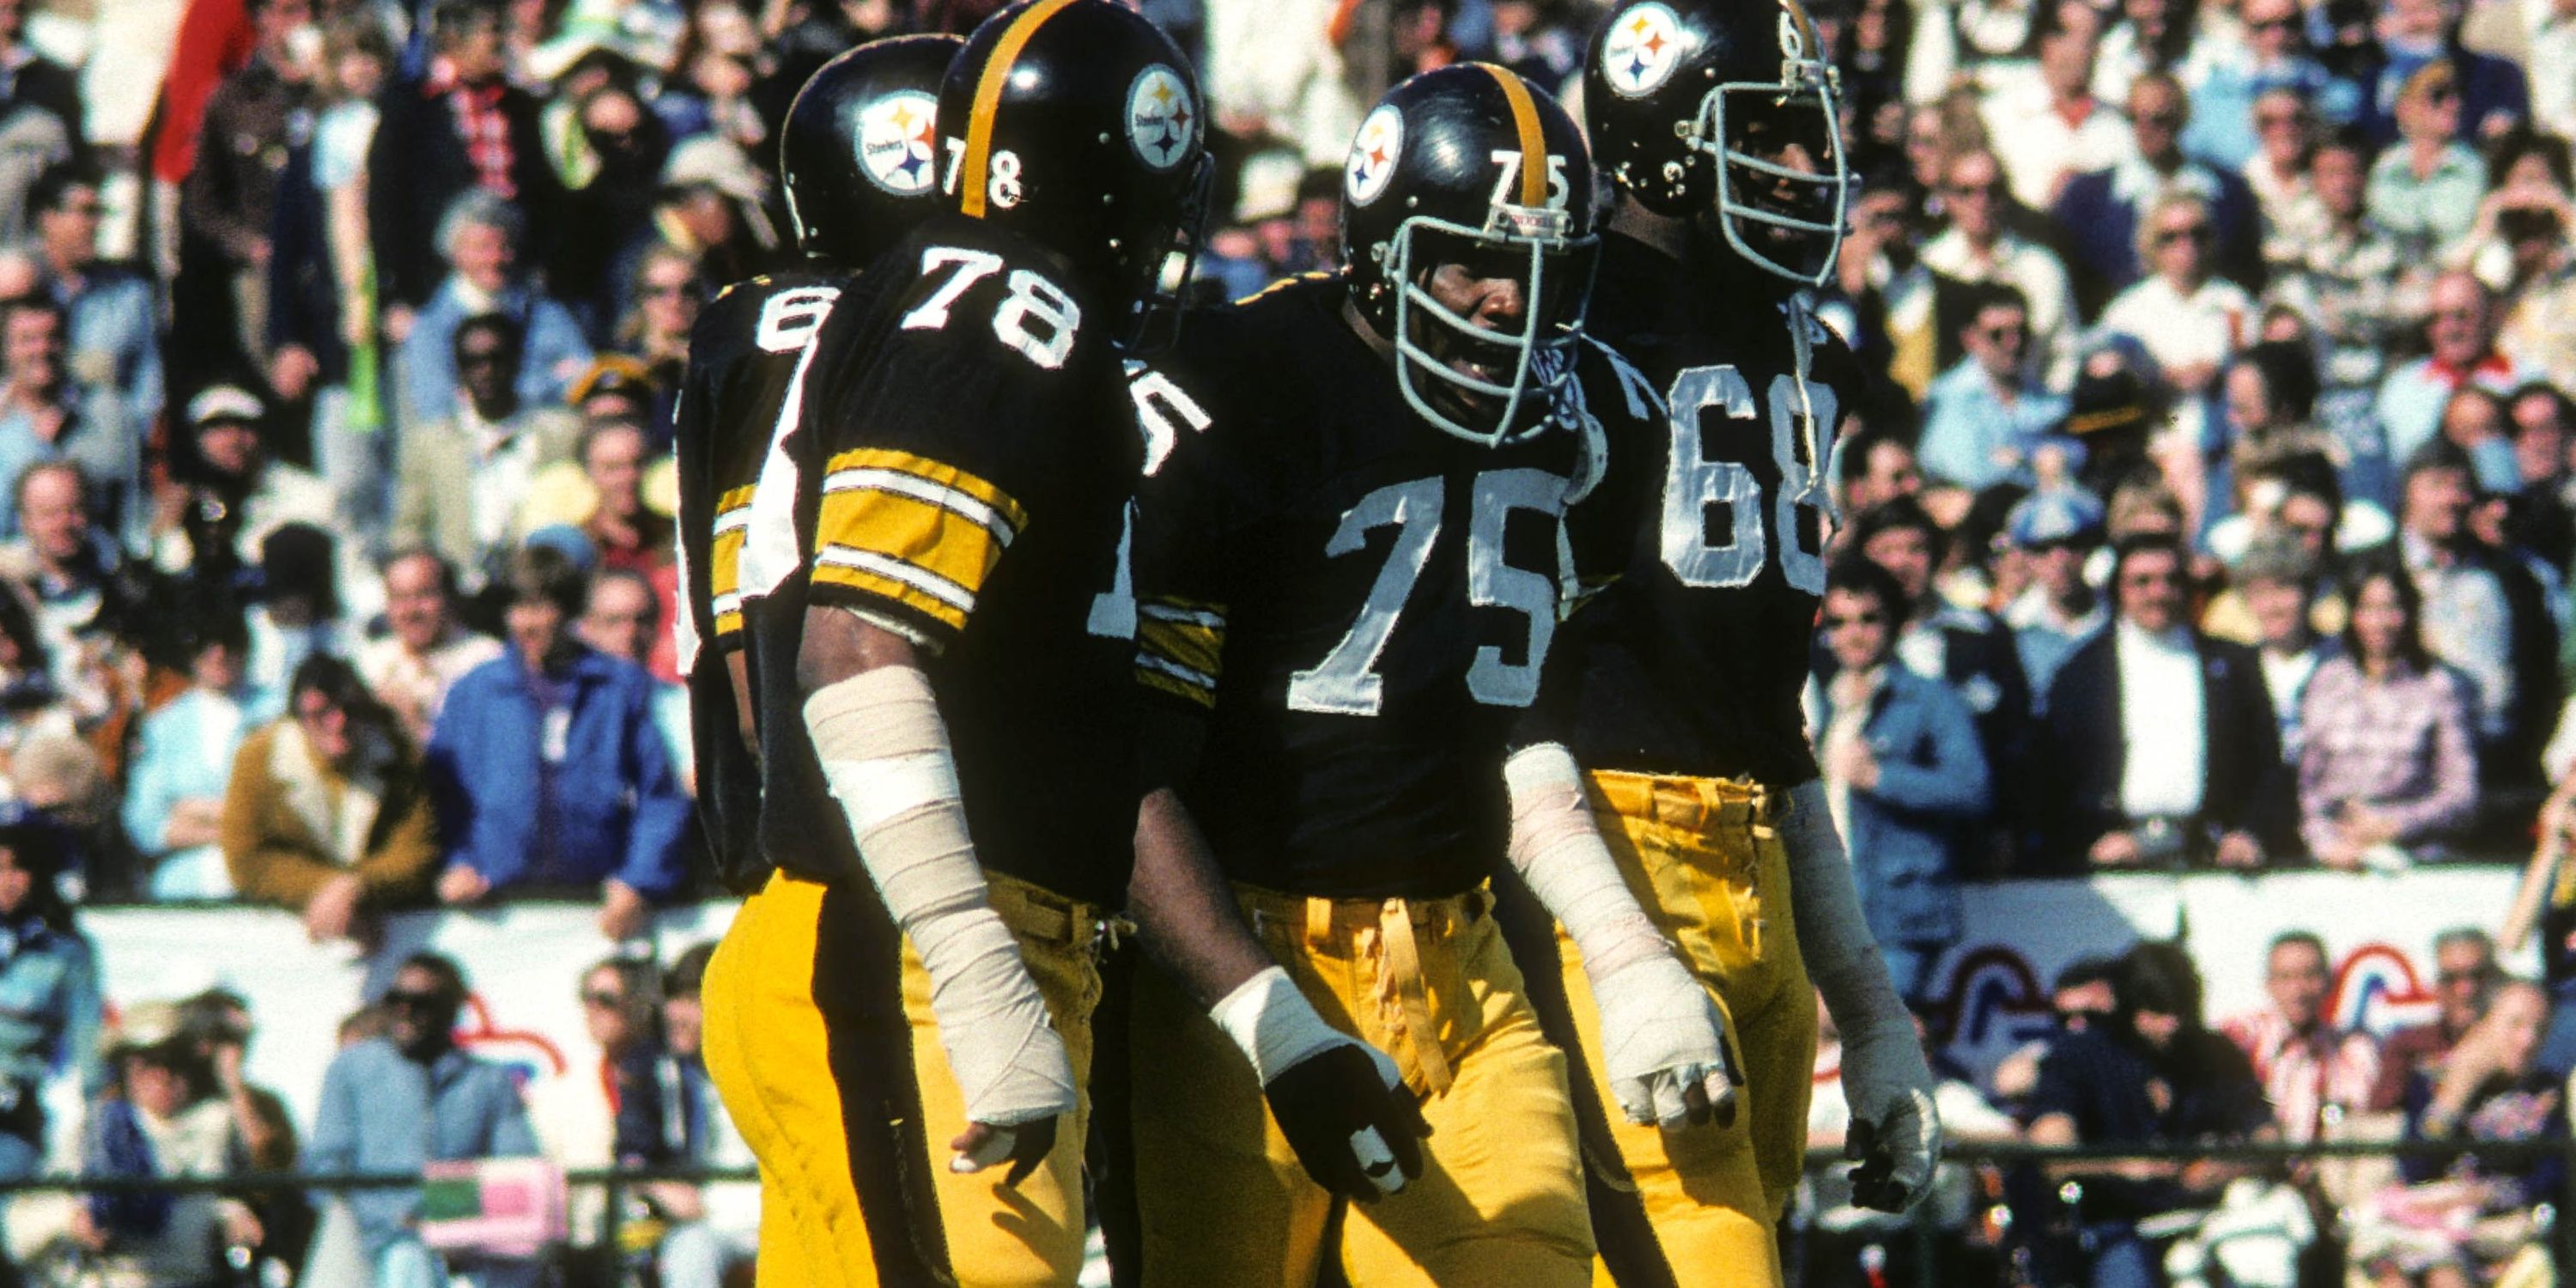
- The Steelers were untouchable at Three Rivers Stadium in the 1970s with a 30% difference in home and away winning percentages.
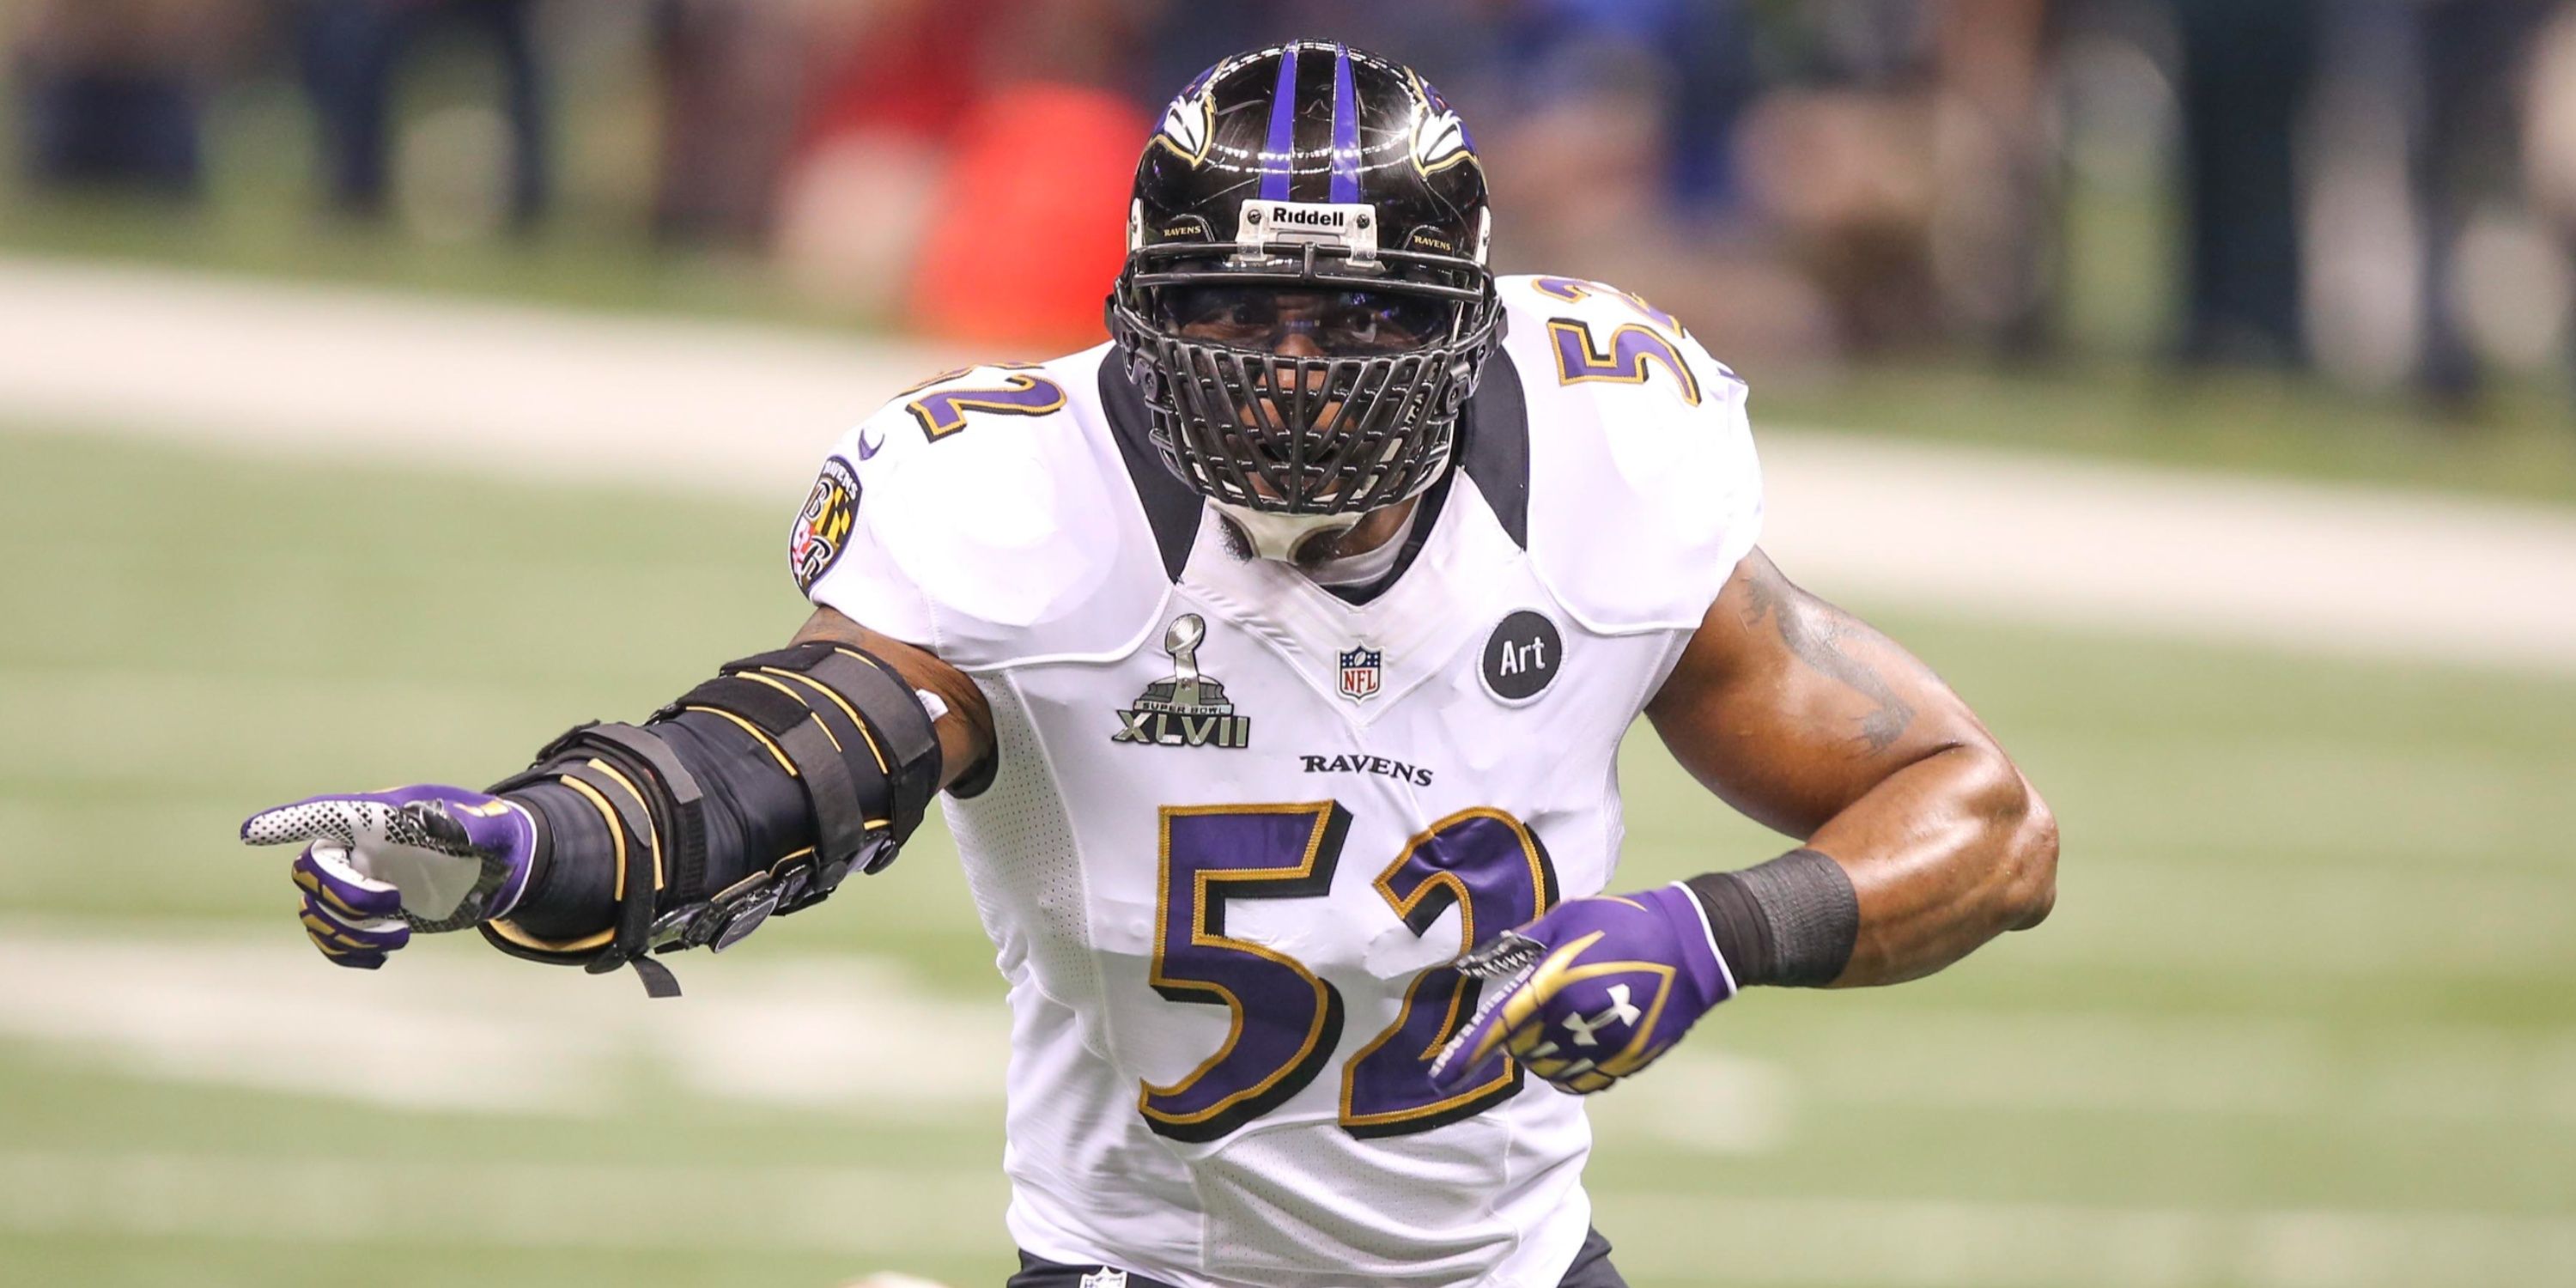
- The Ravens top the 2010s with a 26.3% home field advantage; but the Patriots had an impressive 86.3% overall home winning percentage.
There’s no place like home… Right? Is it as true in the NFL as it was for Dorothy? Is home field advantage still a thing? Was it ever?
Well, the facts say that American football actually has one of the smallest home field advantages when compared to other top professional sports leagues, according to a Chicago Booth Review study from 2015 (via Scorecasting by L. Jon Wertheim and Tobias J. Moskowitz).
Among the major professional sports leagues in the U.S., the NFL’s 57.6 home winning percentage sits behind all but the MLB’s 54.1 home win rate. The highest home advantage lies with the MLS (69.1), followed by the NBA (62.7) and the NHL (59.0).
While the NFL as a whole doesn’t have an extreme home field advantage, certain teams fare much better in their own cozy confines than others. GIVEMESPORT is pulling the curtain back on the best home field advantages in the league for every decade since the 1970s to see just how important playing on your own turf was to the best teams—and which teams had surprisingly effective home field advantages.
Peter Hersh, a data analyzer for the statistical software company JMP, used the difference between home and total winning percentages as the metric by which he judged home team performances. Here’s how we went about our own in-depth look:
- We’ll be using the difference between home and away winning percentage for our study.
- We’ll also be using combined stats for teams that have moved around a bit (we’re looking at you, Las Vegas/Los Angeles/Oakland Raiders).
- Finally, ties are not part of our equation.
|
NFL’s Biggest Home Field Advantages |
||||
|---|---|---|---|---|
|
Team |
Home Wins |
Home Win % |
Away Win% |
Difference |
|
1970s Steelers |
61 |
83.6 |
53.5 |
30.0 |
|
1980s Broncos |
58 |
75.3 |
46.7 |
28.7 |
|
1990s Broncos |
60 |
75.0 |
42.5 |
32.5 |
|
2000s Vikings |
60 |
68.8 |
36.3 |
32.5 |
|
2010s Ravens |
60 |
75.0 |
47.5 |
26.3 |
Leap Day 2024: 10 of the Greatest Leaps in NFL History
GIVEMESPORT looks back at some of the NFL’s most iconic plays involving jumps, hops, flips and leaps for Leap Day 2024.
1970s: Steel Curtain fell hard on opponents at home
Decade average difference: 13.8%
The 1970s were dominated by five teams: The Dallas Cowboys, Pittsburgh Steelers, Miami Dolphins, Oakland Raiders, and Minnesota Vikings. At least one of these teams appeared in every Super Bowl of the decade, and between the five of them, they won nine straight Super Bowls from 1971-1979.
The Cowboys took the title for most wins with 105, which was one more than the Dolphins and five more than the Raiders. However, the Steelers, who were creating one of the greatest dynasties in NFL history, had the most home wins (61), the best home winning percentage at 83.6—the second-highest of any team we looked at for this study—and lost only 12 home games all decade.
The eye-catching number for the Steelers is the stark contrast in winning percentage between home and away, which sits at a whopping 30 percent. While the Detroit Lions (surprise!) had a slightly bigger difference at 30.6 percent, given the total number of wins they had and the fact that Detroit didn’t play many games of consequence, the best home field advantage of the 1970s definitely resided at Three Rivers Stadium.
1980s: Biggest home field advantage doesn’t go to the best team of the decade
Decade Average Difference: 14.4%
The 1980s were ruled by the San Francisco 49ers with 104 total wins and four Super Bowl titles. It really didn’t matter much where they played. Their home winning percentage came in at 64.5, which puts them in a tie for fifth with the Raiders. On the road, though, they simply destroyed, with a winning percentage of 73.4. Washington, their closest competitor in that respect, was a distant second at 58.4 percent.
That puts the 49ers’ home/away difference at -7.9. Yes, they were actually better on the road than at home. This is not to suggest that San Francisco didn’t have a home field advantage, but when you win 73 percent of your away games, you’re just good no matter where you play.
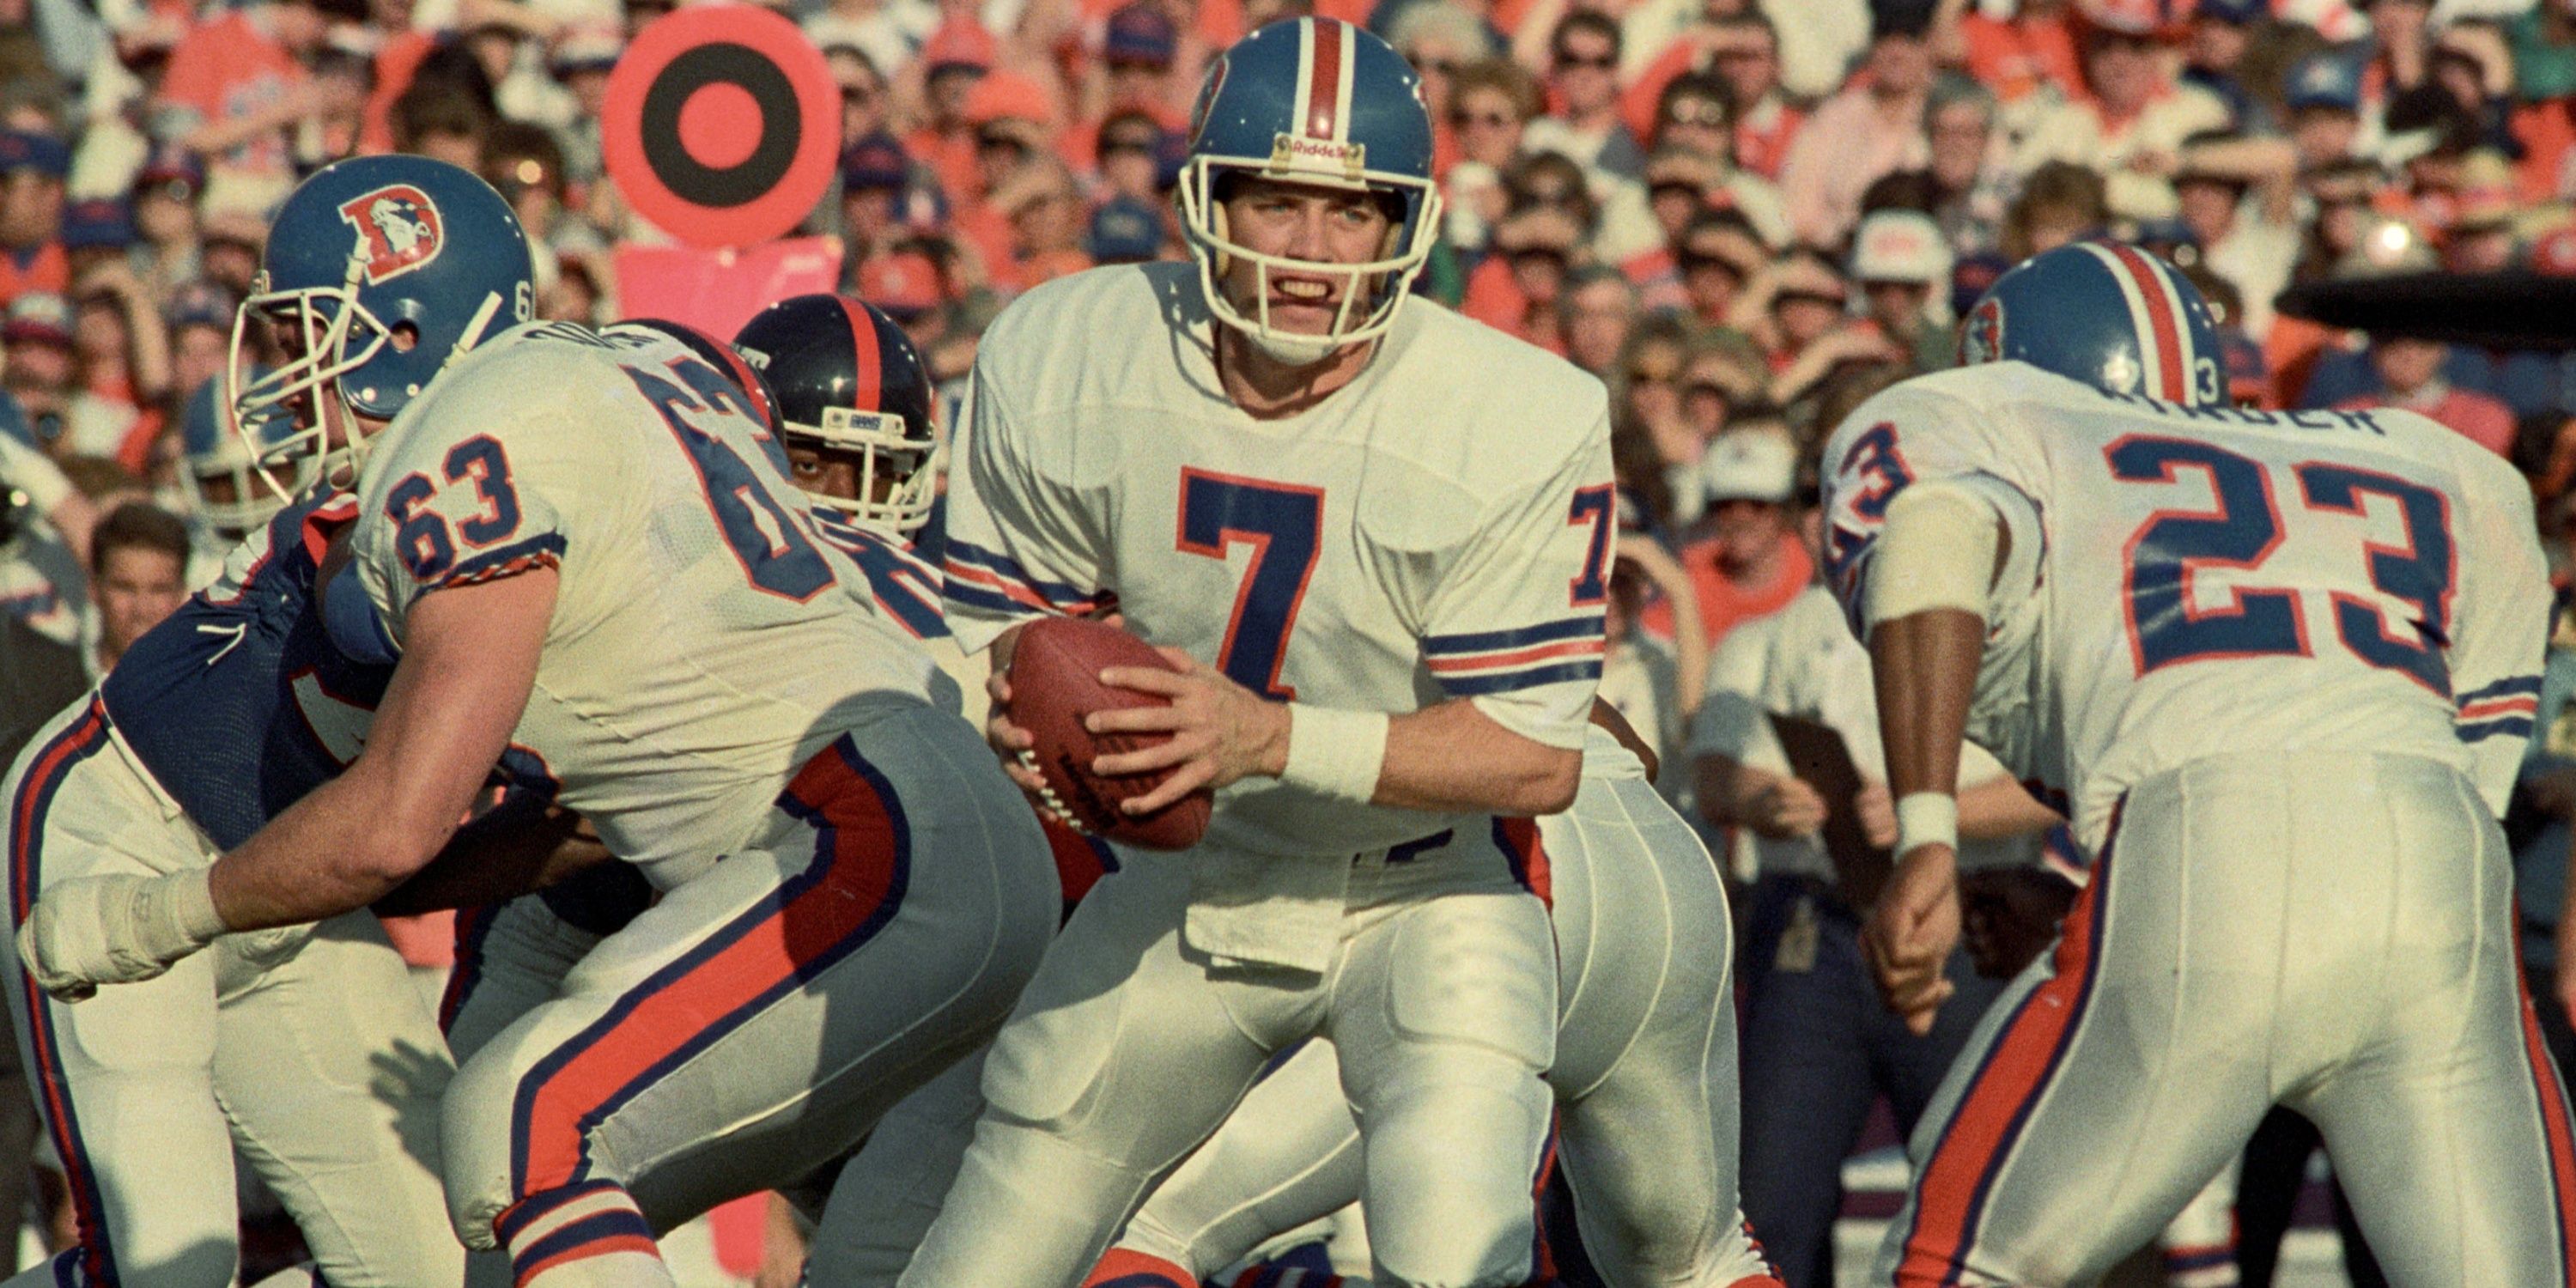
The teams with the biggest differences between their home and road winning percentages were the Houston Oilers (29.0), and the Denver Broncos (28.7). Since Denver led the league in home wins in the 1980s (58), and played in some truly meaningful games throughout the decade, we’ll give them the nod.
1990s: Broncos showed again that it’s not easy to play at Mile High
Decade Average Difference: 19.2%
The 49ers had the most home wins (64), but only one more than the Kansas City Chiefs (63), who were led by 49ers legend Joe Montana for a few years.
San Francisco had a home winning percentage of 80, just ahead of the Chiefs’ 78.8, but while the difference in their home and away winning percentage was more stark than in the 1980s, it still didn’t match what they put up at Mile High.
The Broncos and Atlanta Falcons (surprise again!) tied for the biggest difference in home and away winning percentage for the decade, at 32.5. But since the Broncos won back-to-back Super Bowls (including one against those Falcons), and their home winning percentage (75) was far greater than Atlanta’s (61.3), we’ll give them the nod again for biggest home field advantage of the decade.
2000s: Minnesota turned the Metrodome into a visitor’s house of horrors
Decade Average Difference: 14.1%
The biggest regular season winners of the 2000s were the Indianapolis Colts. They won the most games (115), had the highest winning percentage (71.9), and their 60 home wins put them only one behind the New England Patriots (61) for the top of that category. Of course, New England won three Super Bowls in the decade, so there’s that too.
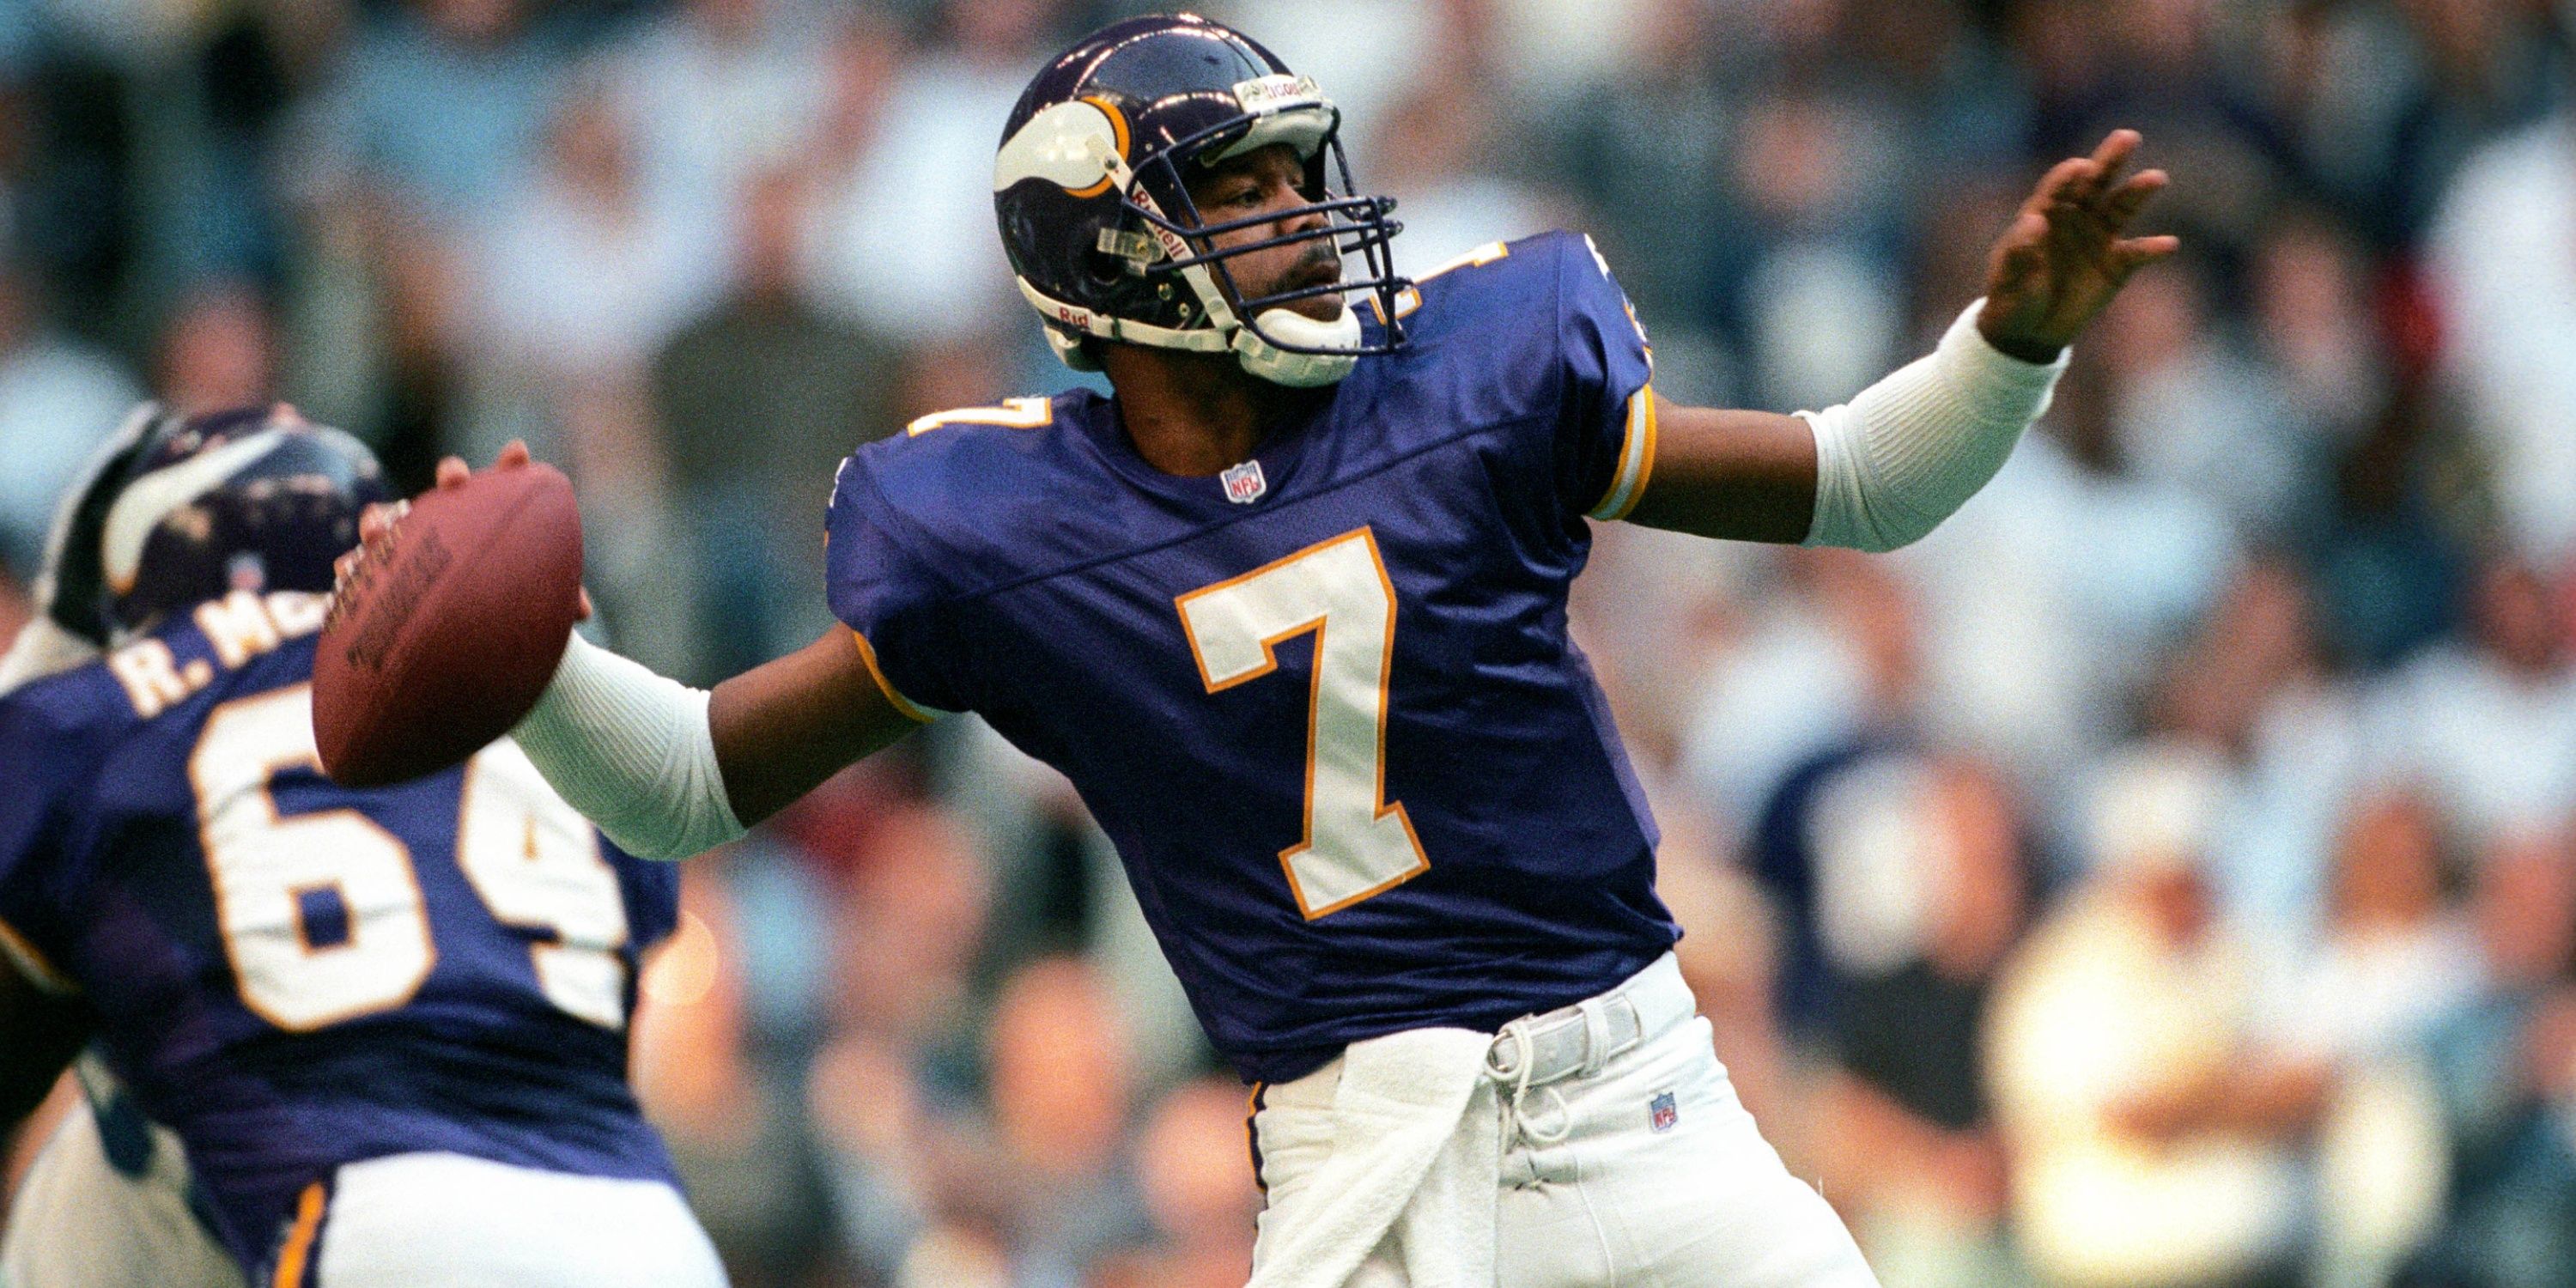
When we talk about home field advantages, though, we have to go to Minnesota. The difference in their success rate at home and on the road was like night and day, as they won at a 32.5 percent higher clip in the Twin Cities.
That’s a big number, so let’s give some love to the Metrodome. Though the Vikings weren’t great during the decade, finishing with the 14th-most wins, Minneapolis was a really tough place to come in and win a ballgame, as the Vikes won 68.8 percent of their games at home, the fifth-best mark in the league.
2010s: Led by an all-time defense, Ravens feasted on home cooking
Decade Average: 13.4%
The 2010s belonged to the Patriots and their GOAT QB, Tom Brady. They led the league in wins (125) and winning percentage (78.1), and won more home games (69) than any other team in any other decade since the 1970 merger. They had an astonishing 86.3 winning percentage at home as well, which is the highest of any team considered in this study.
However, like the 1980s 49ers, the 2010s Patriots were simply good everywhere they played, posting the best road winning percentage (70) during the decade as well. So, the biggest difference between home and away winning percentage for the 2010s goes to the Baltimore Ravens, at 27.5.
Their 60 home wins put them only one win behind the Packers in second place. The Vikings were also right there again with a difference of 26.3. However, Baltimore’s home/away success had a slightly stronger contrast, and they also picked up nine more home wins than the league’s other team in purple, so we’ll give them the edge here.
All statistics courtesy of Pro Football Reference unless stated otherwise.

15 Best Running Backs in NFL History, Ranked
The running backs of today have a long way to go to be held in the same breath as those on this list. Check out GIVEMESPORT’s top 15 RBs.


Leave a Reply